Evaluation of a Foundation Model
A practical framework for understanding model architecture, openness, training, memory, benchmarks, inference performance, cost, safety, and real-world suitability.
Last updated: 2 August 2026 · Model names and leaderboards change rapidly; the evaluation method is intended to remain stable.
A foundation model should never be selected because it is described as “frontier,” because it has the most parameters, or because it tops one leaderboard. The correct question is whether a particular model, version, serving configuration, and surrounding system reliably solves the intended task within acceptable limits for quality, latency, cost, privacy, safety, and operational control.
This page explains what a foundation model is, how model parameters and weights should be interpreted, where the code and checkpoints of open models can be found, how to estimate memory requirements, which public benchmarks are useful, how inference performance should be measured, and how to construct a defensible report card for comparing models such as Claude Opus, Grok, DeepSeek, GPT, Gemini, Llama, Qwen, Mistral, and OLMo.
1. What is a foundation model?
A foundation model is a model trained on broad data, usually at large scale, that can be adapted to many downstream tasks. The adaptation may happen through prompting, retrieval-augmented generation, tool use, fine-tuning, preference optimization, adapters, or by placing the model inside a larger agentic system.
The important word is foundation: the model is not designed for only one narrow prediction problem. It provides general representations and capabilities that can support many applications. A language foundation model may summarize, translate, write code, answer questions, classify documents, operate software tools, and participate in multimodal workflows. Vision, audio, scientific, robotics, and multimodal foundation models follow the same broad idea.
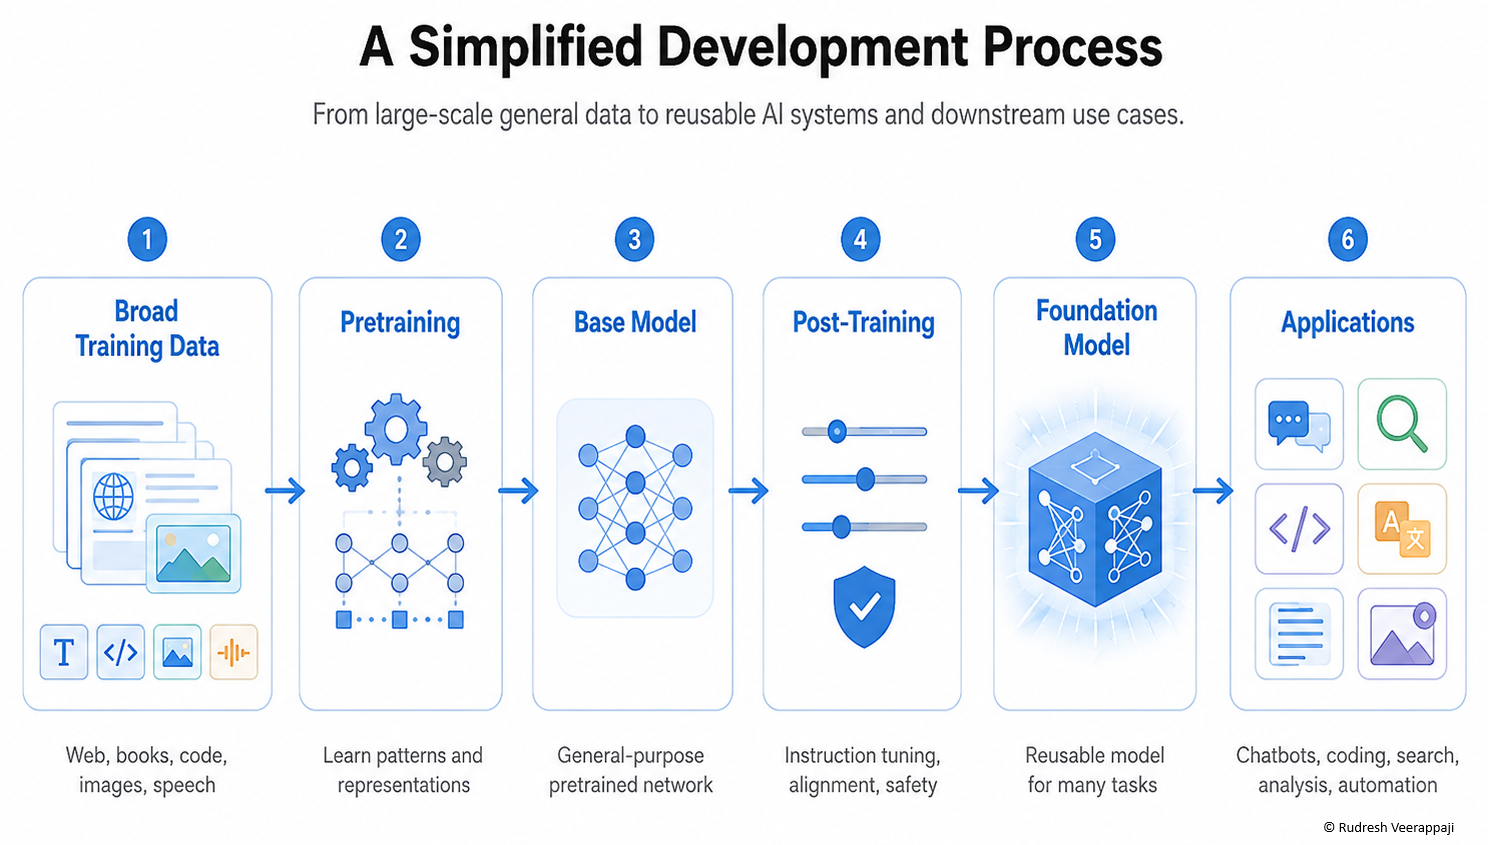
A model is not the entire AI product
A production AI system normally contains more than the neural network. It may also contain a system prompt, search or retrieval, tool definitions, memory, safety filters, a model router, retry logic, a code execution sandbox, document parsers, and user-interface rules. Therefore, an excellent model can perform poorly inside a weak application harness, while a smaller model can perform remarkably well inside a carefully engineered system.
2. Examples in the current model landscape
The following examples illustrate the diversity of foundation-model releases. They are not a permanent ranking. Model families, aliases, prices, and availability change frequently, so the linked provider documentation should be treated as the current source of truth.
| Model family | Typical access model | What is generally visible? | Useful official starting point |
|---|---|---|---|
| Claude Opus — Anthropic | Closed model through hosted products and API | Capabilities, context and API behavior, benchmark results, pricing, system cards; weights and training stack are not downloadable | Claude model overview and system cards |
| GPT — OpenAI | Closed hosted models and products | Model capabilities, API interfaces, context, pricing, selected evaluations and safety documentation; parameters and weights are generally undisclosed | OpenAI model documentation |
| Gemini — Google | Closed hosted models through Google products, AI Studio, and APIs | Model variants, modality support, context limits, rate limits, pricing, and selected evaluation reports | Gemini API model catalogue |
| Grok — xAI | Closed hosted models and API | Model IDs, release information, context and API behavior, selected benchmark and speed claims; weights are not generally downloadable | xAI model documentation |
| DeepSeek | Hosted API plus downloadable releases for several model families | Weights, model cards and technical reports for open releases; the exact degree of data and training-code disclosure must be checked per release | DeepSeek transparency centre and Hugging Face organization |
| Llama — Meta | Open-weight distribution under a model-specific licence | Downloadable checkpoints, architecture and usage materials; not all training data or full reproducibility artifacts are available | Llama official site and Hugging Face organization |
| Qwen — Alibaba | Many open-weight releases; hosted services also available | Weights, configs, tokenizers, model cards, technical reports, and often permissive licensing; release details vary by model | Qwen project site and Hugging Face organization |
| Mistral | Combination of open-weight and commercial hosted models | Open checkpoints for selected models; licences and disclosure levels vary across the portfolio | Mistral models overview and Hugging Face organization |
| OLMo — Ai2 | Fully open research-oriented releases | Weights, code, data mixtures, training recipes, checkpoints, logs, and evaluations for reproducibility and inspection | OLMo project page and training code |
3. Closed, open-weight, and fully open models
The phrase “open-source model” is frequently used too loosely. In conventional software, source code is the preferred form for modification. In machine learning, the final weights are important, but they are only one part of the system. A serious evaluation should distinguish at least three release patterns.
Closed model
The provider hosts the model and exposes it through a product or API. The user cannot inspect or download the weights. Architecture, parameter count, training data, and training code may be partly or entirely undisclosed.
Easy to consumeLow infrastructure burdenVendor dependencyOpen-weight model
The trained checkpoint can be downloaded and run independently. Inference code and architecture definitions are normally available, but the full training data, data-cleaning pipeline, optimization recipe, and intermediate checkpoints may not be.
Self-hostingFine-tuningNot necessarily reproducibleFully open model
The release aims to expose the weights, architecture, training and inference code, data or sufficiently detailed data information, training recipe, evaluations, and a licence that permits study and modification.
InspectabilityReproducibilityResearch valueWhy the distinction matters
Open weights enable local deployment, quantization, fine-tuning, controlled versioning, and deeper inspection. They do not automatically reveal why the model behaves as it does, what copyrighted or sensitive data may have been used, how the data were filtered, or whether the model can be recreated. Fully open releases provide much stronger scientific transparency, but they may still trail closed frontier systems on some capabilities or require substantial engineering effort to deploy efficiently.
A licence must be evaluated separately from technical availability. A model may be downloadable yet impose restrictions on commercial use, redistribution, user scale, specific applications, or derivative models. “Available on Hugging Face” is not the same as “unrestricted open source.”
4. For an open model, where are the code, algorithm, and weights?
There is rarely one file called “the algorithm.” The model is distributed as a collection of artifacts. The architecture specifies the mathematical structure; the weights contain the learned numerical values; the tokenizer converts text into tokens; training code produces the checkpoint; and inference code executes it efficiently.
Files commonly found in a model repository
| Artifact | Typical files | What it tells you |
|---|---|---|
| Model card | README.md | Intended use, limitations, training summary, benchmark results, licence, examples, and citations. |
| Architecture configuration | config.json | Layer count, hidden size, attention heads, vocabulary size, positional settings, model type, and other architecture parameters. |
| Weights or checkpoint shards | model-00001-of-000xx.safetensors, pytorch_model.bin | The learned tensors. Large models are split into multiple files. |
| Weight index | model.safetensors.index.json | Maps each tensor name to the shard containing it. |
| Tokenizer | tokenizer.json, tokenizer.model, vocabulary and merges files | How text is segmented and mapped to token IDs. |
| Generation defaults | generation_config.json | Suggested decoding settings such as temperature, top-p, and special tokens. |
| Architecture implementation | Library files such as modeling_*.py or an external GitHub repository | The forward pass, attention implementation, routing for mixture-of-experts models, and tensor shapes. |
| Training code and recipe | Separate GitHub repository, YAML files, launch scripts, optimizer settings | How data, compute, parallelism, learning rates, and checkpoints were used to produce the model. |
| Data card or data mixture | Dataset repository, manifests, filtering and deduplication code | What data categories were used and how the corpus was built. |
| Licence | LICENSE, model-card metadata, provider terms | Your rights and obligations for use, modification, redistribution, and commercial deployment. |
A repeatable inspection method
- Start at the provider’s official release page or verified Hugging Face organization.
- Read the model card before downloading anything.
- Check the exact licence and whether the release is base, instruct, reasoning, multimodal, or task-specific.
- Open
config.jsonto inspect the architecture and parameterization. - Inspect the “Files and versions” tab for checkpoint shards, tokenizer files, and revisions.
- Follow links to the technical report and source repository.
- Look for training scripts, data manifests, optimizer settings, intermediate checkpoints, logs, and evaluation harnesses.
- Record the commit hash or model revision used in your evaluation.
Example: loading and inspecting a Hugging Face model
from transformers import AutoConfig, AutoTokenizer
from huggingface_hub import model_info

MODEL_ID = "organization/model-name"

info = model_info(MODEL_ID)
config = AutoConfig.from_pretrained(MODEL_ID, trust_remote_code=False)
tokenizer = AutoTokenizer.from_pretrained(MODEL_ID, use_fast=True)

print("Revision SHA:", info.sha)
print("Architecture:", getattr(config, "architectures", None))
print("Hidden size:", getattr(config, "hidden_size", None))
print("Layers:", getattr(config, "num_hidden_layers", None))
print("Attention heads:", getattr(config, "num_attention_heads", None))
print("Vocabulary size:", tokenizer.vocab_size)trust_remote_code=True. It can execute custom code from a repository. Review the source and pin a revision before using it in a controlled environment.
5. Anatomy of a model release
When a provider announces a new model, the announcement usually combines several layers that should be evaluated separately.
Neural architecture
Transformer type, dense or mixture-of-experts design, layer count, hidden dimensions, attention method, positional encoding, multimodal encoders, and routing structure.
Checkpoint
The exact learned weights after a particular training run. A checkpoint is the reproducible object you download, hash, quantize, fine-tune, and serve.
Tokenizer
The mapping between raw text and token IDs. Tokenization affects context usage, multilingual efficiency, code performance, and billing for token-priced APIs.
Post-training
Instruction tuning, preference learning, reinforcement learning, safety training, tool-use training, reasoning training, and style optimization.
Inference-time policy
Reasoning effort, sampling settings, hidden chain-of-thought handling, tool access, search, context compression, caching, and response limits.
Serving system
Hardware, quantization, batching, parallelism, scheduler, speculative decoding, caching, uptime, regional hosting, and rate limits.
Two services can host the same open-weight checkpoint yet deliver different latency, output quality, maximum context, concurrency, and cost. Similarly, a provider may silently update a model alias while retaining the same friendly name. For reproducibility, prefer versioned model IDs and pin exact checkpoint revisions.
6. What are parameters and weights?
A parameter is a numerical value inside the neural network that can be adjusted during training. Weights are the major class of learned parameters that control how strongly one representation influences another. Biases, normalization scales, embedding tables, routing values, and other learned tensors are also parameters.
| Parameter type | What it is |
|---|---|
| Weights | Learned coefficients that determine how strongly one neuron, token representation, or feature influences another during the forward pass. |
| Biases | Learned offset values added to weighted sums so a layer can shift its output independently of the input magnitude. |
| Normalization scales | Learned scale parameters used in normalization layers such as LayerNorm or RMSNorm to control the magnitude of normalized activations. |
| Normalization offsets | Learned shift parameters, used in some normalization schemes, that move normalized activations after scaling. |
| Embedding tables | Large learned matrices that map discrete token IDs or positions into continuous vector representations the model can process. |
| Routing values | Learned parameters in mixture-of-experts models that help decide which expert blocks should process a given token. |
| Other learned tensors | Additional trainable values tied to specific architectural components, such as gating mechanisms, projection layers, or multimodal adapters. |
During pretraining, the model repeatedly predicts missing or next tokens, compares its predictions with the training target, calculates an error, and updates parameters using gradient-based optimization. After many updates, the final collection of values is stored as a checkpoint. Inference uses those learned values to transform an input sequence into probabilities over possible outputs.
What does “a 1 billion parameter model” mean?
It means the model contains approximately one billion learned scalar values. It does not mean the model stores one billion facts, has one billion lines of code, or has a directly measurable amount of intelligence. Parameter count describes scale, but capability also depends on architecture, training data, number of training tokens, optimization, post-training, context design, and inference-time computation.
Dense models versus mixture-of-experts models
In a dense model, nearly all parameters participate in each token’s forward pass. In a mixture-of-experts model, a router selects only a subset of expert blocks for each token. Therefore, an MoE release may advertise both total parameters and active parameters. Total parameters mainly influence storage and aggregate capacity; active parameters more strongly influence the computation required per token. They are not interchangeable measures.
For example, a model described as “235B total / 22B active” stores roughly 235 billion parameters, while the routing mechanism activates a much smaller subset for a token. Its memory footprint can resemble a very large model, while its per-token compute can be closer to a smaller dense model—although communication, routing, cache, and parallelism overhead still matter.
7. How much memory does a model need?
The simplest lower-bound estimate is parameter count multiplied by bytes per stored parameter. This estimates weight memory only.
| Model size | FP32 4 bytes | FP16/BF16 2 bytes | INT8 1 byte | 4-bit 0.5 byte |
|---|---|---|---|---|
| 1B parameters | 4 GB | 2 GB | 1 GB | 0.5 GB |
| 7B parameters | 28 GB | 14 GB | 7 GB | 3.5 GB |
| 13B parameters | 52 GB | 26 GB | 13 GB | 6.5 GB |
| 32B parameters | 128 GB | 64 GB | 32 GB | 16 GB |
| 70B parameters | 280 GB | 140 GB | 70 GB | 35 GB |
| 405B parameters | 1.62 TB | 810 GB | 405 GB | 202.5 GB |
Actual inference memory is higher because the runtime also needs temporary activations, CUDA or accelerator kernels, allocator headroom, attention workspaces, the KV cache, and sometimes duplicated buffers. Quantization metadata and dequantization work also add overhead. A practical deployment should therefore leave headroom instead of matching the theoretical weight size exactly.
The KV cache
Autoregressive generation stores attention keys and values for previous tokens so they do not need to be recomputed at every decoding step. The KV cache grows with sequence length and batch size. Long contexts and many concurrent users can therefore exhaust GPU memory even when the weights fit comfortably.
Grouped-query attention and multi-query attention reduce KV-cache size by using fewer key/value heads than query heads. This is one reason architecture matters independently of parameter count.
Training requires far more memory than inference
Full training stores weights, gradients, optimizer states, activations, and communication buffers. A basic Adam-style optimizer can require several times the raw parameter memory before activation memory is counted. Distributed training techniques such as tensor parallelism, pipeline parallelism, data parallelism, ZeRO, sharding, checkpointing, and mixed precision are used because frontier models cannot fit on one accelerator.
8. How much training was done?
“How large is the model?” and “how much was it trained?” are different questions. Parameter count measures the size of the learned state. Training amount describes the data and compute used to produce that state. A model release should ideally provide enough information to understand both.
Training information worth recording
| Field | Why it matters |
|---|---|
| Pretraining tokens | Indicates the amount of tokenized data processed. It should be interpreted alongside parameter count, deduplication, data quality, and repeated epochs. |
| Data mixture | Web text, books, code, scientific documents, synthetic data, multilingual data, images, audio, and domain data shape the model’s strengths and biases. |
| Training compute | Often expressed in floating-point operations or accelerator-hours. This is more informative than calendar time alone. |
| Hardware and parallelism | Accelerator type, number of devices, networking, and distributed strategy affect cost and reproducibility. |
| Context curriculum | A model may be pretrained mostly at shorter lengths and extended later. Advertised maximum context does not prove uniform quality across the entire window. |
| Post-training data | Instruction datasets, preference data, reinforcement learning, tool-use trajectories, and synthetic reasoning traces strongly affect user-facing behavior. |
| Intermediate checkpoints and logs | Allow researchers to study learning dynamics, reproduce failures, and verify the stated training process. |
| Data provenance and governance | Important for copyright, privacy, bias, regulatory, security, and organizational risk assessments. |
Closed frontier providers commonly disclose only part of this information. The absence of disclosure should not be filled with guesses. Record it as not disclosed and treat transparency as a separate evaluation dimension. Open-weight releases also vary considerably: some publish only the final checkpoint, while projects such as OLMo intentionally publish data, code, recipes, logs, and intermediate checkpoints.
9. Base, instruct, reasoning, and agentic variants
A model family often contains several variants that should not be compared as though they were identical.
| Variant | Primary purpose | Evaluation emphasis |
|---|---|---|
| Base or pretrained | Next-token prediction before instruction alignment | Perplexity, few-shot learning, continuation quality, representation quality, fine-tuning potential |
| Instruct or chat | Follow user requests and conversational norms | Instruction adherence, helpfulness, formatting, refusal calibration, truthfulness |
| Reasoning | Use more inference-time computation for difficult problems | Task success versus token use, latency, cost, robustness, calibration, reasoning-effort controls |
| Code | Code generation, repair, repository work, or tool use | Executable correctness, test passing, repository-scale tasks, latency in iterative loops |
| Multimodal | Process combinations of text, images, audio, or video | Cross-modal grounding, OCR, charts, spatial reasoning, modality-specific latency and limits |
| Agentic or computer-use | Plan, call tools, browse, operate interfaces, and persist across steps | End-to-end completion, recovery from errors, tool selection, security, cost per completed task |
| Embedding | Map text or other inputs into vectors | Retrieval quality, clustering, multilingual performance, vector dimensions, speed and storage |
Reasoning models require special care. A score obtained with maximum reasoning effort and a large token budget should not be compared directly with a fast default mode. Record the reasoning setting, output-token count, number of attempts, tool access, and total cost.
10. Evaluation criteria in priority order
The correct priority order begins with the actual use case, not with public leaderboards. The following order is a strong default for enterprise and engineering evaluations. The weights can be adjusted, but the ordering prevents teams from optimizing cost or benchmark scores before establishing usefulness and safety.
- Task success on representative work. Build a private evaluation set from real prompts, documents, languages, edge cases, and failure modes. Measure complete task success rather than surface fluency.
- Reliability, factuality, and grounding. Measure unsupported claims, citation correctness, consistency across repeated runs, uncertainty calibration, and the ability to say that evidence is insufficient.
- Safety, security, privacy, and compliance. Evaluate prompt injection, data leakage, unsafe tool calls, policy compliance, access controls, retention, residency, auditability, and regulatory obligations.
- Instruction following and controllability. Test format compliance, system-prompt adherence, structured output, tool-use rules, tone, verbosity, and resistance to conflicting instructions.
- Latency and throughput under realistic load. Record time to first token, generation speed, end-to-end latency, p95 and p99 tails, concurrency, queueing, and cold starts.
- Total cost per successful task. Include input and output tokens, reasoning tokens, retries, retrieval, tool calls, hosting, GPUs, engineering time, and human review—not merely list price per million tokens.
- Context, retrieval, and tool-use quality. Test the lengths and document types you actually use. Measure information retrieval, multi-document reasoning, context dilution, and tool-selection accuracy.
- Deployment control and ecosystem fit. Consider licence, self-hosting, regional availability, fine-tuning, observability, version pinning, framework support, quantization, and vendor lock-in.
- Transparency and reproducibility. Assess model cards, technical reports, system cards, data disclosure, evaluation harnesses, checkpoint hashes, and change logs.
- Public benchmark evidence. Use reputable benchmarks as supporting evidence and diagnostic clues, not as the final selection decision.
A suggested weighted score
| Dimension | Suggested weight | Example measure |
|---|---|---|
| Representative task success | 30% | Percentage of end-to-end tasks accepted by domain reviewers |
| Reliability and groundedness | 15% | Supported-claim rate, citation precision, repeatability |
| Safety, security, privacy, compliance | 15% | Red-team pass rate and policy-control assessment |
| Instruction following and controllability | 10% | Schema validity, constraint adherence, tool-call correctness |
| Latency and throughput | 10% | p50/p95 TTFT, tokens per second, requests per second |
| Total cost per successful task | 10% | All-in cost divided by accepted completions |
| Context, retrieval, and tools | 5% | Long-document and tool-use task score |
| Deployment control and transparency | 5% | Licence, self-hosting, versioning, documentation, auditability |
11. Standard and reputable benchmark families
No single benchmark measures “intelligence.” A defensible evaluation uses a portfolio selected for the intended capabilities, then validates the findings on private tasks. The table below emphasizes benchmarks with public papers, code, leaderboards, or transparent methodologies.
| Capability | Benchmark or framework | What it measures | Important caution |
|---|---|---|---|
| Broad knowledge and reasoning | MMLU-Pro | Challenging multi-domain multiple-choice questions with greater reasoning emphasis than the original MMLU | Academic test performance is not the same as workplace task success; prompt format and chain-of-thought policy affect results |
| Graduate-level science | GPQA / GPQA Diamond | Expert-written questions in biology, physics, and chemistry | Small test sets can produce noisy differences; verify whether results use the full set or Diamond subset |
| Expert knowledge frontier | Humanity’s Last Exam | Difficult expert-level questions across many disciplines | High academic accuracy still does not establish autonomy, judgment, or real-world reliability |
| Fluid and abstract reasoning | ARC-AGI benchmark series | Generalization to novel abstract tasks; newer versions include interactive agentic environments | Scores are highly sensitive to the allowed harness, search, test-time adaptation, and action budget |
| Instruction following | IFEval | Verifiable constraints such as length, keywords, formatting, and structure | Tests explicit constraints more than nuanced intent, helpfulness, or domain correctness |
| Algorithmic coding | LiveCodeBench | Continuously refreshed coding problems plus execution, self-repair, and related tasks | Record the date window, language, pass@k, and whether execution feedback was available |
| Repository-scale software engineering | SWE-bench and SWE-bench Verified | Resolution of real GitHub issues by modifying code repositories | This evaluates the model plus agent harness, tools, environment, budget, and retry strategy |
| Long-context understanding | RULER, LongBench v2, and NoLiMa | Retrieval, reasoning, and understanding across long sequences and documents | A claimed context window is only a capacity limit; quality can degrade long before that limit |
| Multimodal reasoning | MMMU | College-level reasoning over diagrams, charts, images, tables, and other visual forms | Image resolution, OCR preprocessing, crop strategy, and tool access can materially change scores |
| Holistic evaluation | Stanford HELM | Transparent evaluation across scenarios and dimensions such as accuracy, calibration, robustness, fairness, and efficiency | Use the scenario-level results rather than reducing everything to one average |
| Human preference | Arena leaderboards | Crowdsourced pairwise preferences for model responses in open-ended interactions | Preference can reward style, verbosity, and confidence; it is not a direct factuality or safety score |
| Inference-system performance | MLPerf / MLCommons | Reproducible system-level performance for inference across datacenter, edge, client, and other settings | Hardware benchmark results do not directly measure answer quality or application success |
Benchmarks should be grouped by purpose
Capability benchmarks
Ask whether the model can solve a class of problems: mathematics, science, coding, instruction following, long-context reasoning, vision, or tool use.
Behavioral evaluations
Measure factuality, uncertainty, calibration, bias, safety, privacy, prompt-injection resistance, and adherence to organizational policy.
System benchmarks
Measure latency, throughput, concurrency, memory, energy, reliability, and cost on a particular serving stack.
Application evaluations
Measure whether the complete system successfully performs real user work, including retrieval, tools, workflows, and human review.
12. Inference and serving metrics
Inference metrics describe what happens when a trained model is used to generate outputs. They depend on the checkpoint, precision, hardware, serving engine, prompt length, output length, batch size, concurrency, and network path. A single “tokens per second” number without these conditions is not meaningful.
| Metric | Definition | Why it matters |
|---|---|---|
| Time to first token (TTFT) | Time from request arrival until the first generated token is returned | Dominates perceived responsiveness for interactive chat and short answers |
| Inter-token latency (ITL) / time per output token (TPOT) | Time between successive generated tokens after the first | Determines how smoothly a streamed answer appears |
| Output tokens per second | Generation rate after or including prefill, depending on the tool’s definition | Useful for comparing decode speed, but definitions must be aligned |
| End-to-end latency | Total time from request submission to final response | Captures prompt processing, queueing, generation, tools, and network overhead |
| Throughput | Tokens or completed requests handled per second by the system | Determines capacity and infrastructure cost under concurrent load |
| Tail latency | p95 or p99 latency rather than only the average | Shows the experience of slower requests and queueing under load |
| Prefill throughput | Speed of processing input tokens before generation | Critical for long prompts, document analysis, and retrieval-heavy workloads |
| KV-cache usage | Memory consumed by cached attention keys and values | Constrains context length, batch size, and concurrency |
| Cost per million tokens | Provider charge for input, cached input, output, or reasoning tokens | Useful for budgeting, but not sufficient without task success and token efficiency |
| Cost per successful task | Total inference and operational cost divided by accepted completions | The most decision-relevant economic measure |
| Energy per query or token | Energy used by the serving system for a workload | Relevant to capacity, sustainability, and datacenter planning |
| Error and availability rate | Timeouts, rate-limit errors, malformed responses, and service uptime | A model that is accurate but unavailable is not operationally reliable |
Measure under a latency–throughput curve
Serving systems trade individual-user latency against aggregate throughput. Larger batches improve accelerator utilization and throughput but can increase queueing and inter-token delays. Report several concurrency points rather than one best-case number.
13. Building a benchmark report card
A report card should make test conditions visible and prevent a high score in one area from hiding unacceptable failures elsewhere. Separate externally reported benchmark numbers from your own measurements.
Report-card header
| Field | Example entry |
|---|---|
| Model | Exact provider model ID or open-weight repository and revision SHA |
| Evaluation date | YYYY-MM-DD |
| Access path | Provider API, hosted third party, local checkpoint, or product UI |
| Configuration | Reasoning effort, temperature, top-p, max output, tools, search, system prompt |
| Infrastructure | Hardware, serving engine, precision, quantization, region, concurrency |
| Data | Evaluation-set version, sample count, languages, domains, sensitive-data classification |
| Scoring | Exact-match, pass rate, human rubric, LLM judge, pairwise preference, or composite |
Illustrative report card — hypothetical values
| Dimension | Weight | Model A closed API | Model B open-weight 32B | Model C fast API |
|---|---|---|---|---|
| Representative task success | 30% | 91 | 82 | 85 |
| Groundedness and reliability | 15% | 88 | 81 | 79 |
| Safety, security, and compliance | 15% | 90 | 76 | 87 |
| Instruction following | 10% | 92 | 85 | 88 |
| Latency and throughput | 10% | 72 | 66 | 96 |
| Cost per successful task | 10% | 68 | 84 | 91 |
| Context, retrieval, and tools | 5% | 91 | 73 | 82 |
| Control and transparency | 5% | 45 | 95 | 50 |
| Weighted total | 100% | 84.5 | 80.7 | 85.8 |
In this hypothetical example, Model C has the highest total because speed and economics matter to the chosen workload, even though Model A has the highest raw quality. Model B remains strategically attractive where self-hosting, inspection, customization, or data control outweighs some capability loss. The report card makes the trade-off explicit rather than pretending that one model is universally best.
Examples of real release documentation
14. A practical model-evaluation workflow
Step 1 — Define the decision
State the application, user population, risk level, languages, data sensitivity, expected volume, latency target, budget, deployment constraints, and what a successful answer or action looks like.
Step 2 — Build a private evaluation set
Collect representative tasks from real work. Include normal cases, difficult cases, ambiguous requests, adversarial instructions, long documents, multilingual examples, missing information, and tasks for which the correct action is to abstain or ask a question. Remove personal or confidential data unless the evaluation environment is approved for it.
Step 3 — Create an evaluation contract
Freeze the system prompt, tool definitions, retrieval configuration, sampling settings, output schema, reasoning effort, maximum tokens, retry policy, and scoring rubric. Without a contract, teams unintentionally tune each model differently and invalidate the comparison.
Step 4 — Establish baselines
Include the current production system, a simple non-AI method where applicable, one strong closed model, one economical model, and one self-hostable model. Baselines reveal whether increased complexity produces meaningful value.
Step 5 — Run capability and behavioral tests
Use private task evaluations first, followed by selected public benchmarks. Run repeated trials where outputs are stochastic. Measure task success, groundedness, instruction compliance, safety, and consistency separately.
Step 6 — Benchmark the full system
Test realistic prompt lengths, output lengths, concurrency, retrieval, tool use, network conditions, and failure recovery. Measure latency distributions and error rates rather than only averages.
Step 7 — Normalize economics
Calculate cost per accepted task. Include retries, long reasoning traces, cached input, vector search, tool calls, human review, and self-hosting infrastructure. A cheaper token price can still yield a more expensive completed task.
Step 8 — Perform security and governance review
Review data handling, retention, region, provider terms, licence, access controls, logging, prompt injection, tool permissions, supply-chain risk, model provenance, and incident procedures.
Step 9 — Pilot with shadow traffic
Run candidate models on sampled real traffic without allowing them to take irreversible actions. Compare against the production outcome and collect domain-expert judgments.
Step 10 — Select, version, and monitor
Pin model versions where possible, establish regression gates, monitor quality and latency, and schedule re-evaluation when the provider updates an alias, changes pricing, retires a model, or releases a materially different version.
15. Common benchmark and model-comparison errors
Comparing unlike settings
One score may use tools, search, maximum reasoning effort, multiple attempts, or a private prompt, while another uses a single direct answer.
Ignoring benchmark contamination
Public questions or close variants can enter training data. Continuously refreshed, private, or held-out tests reduce but do not eliminate this risk.
Using saturated benchmarks
When most models score near the ceiling, small differences become unstable and no longer distinguish practical capability well.
Treating an average as universal
Composite scores can hide severe weaknesses in a language, domain, safety category, or task that is crucial to the application.
Using an LLM judge without validation
Automated judges may prefer verbosity, share biases with the tested model, or mis-score specialized content. Calibrate against expert human ratings.
Ignoring variance
Report sample count, repeated runs, confidence intervals, and statistical significance. A one-point difference on a small set may be noise.
Confusing context capacity with context quality
A million-token limit does not guarantee reliable retrieval, reasoning, or attention across a million tokens.
Ignoring model drift and aliases
A friendly API name may point to a newer snapshot later. Re-test after provider changes and record versioned IDs whenever available.
Optimizing tokens instead of outcomes
Low price per token is not equivalent to low cost per successful task; weak models may produce more retries and human correction.
Evaluating the model but deploying an agent
Tool permissions, browser environments, retrieval, memory, and retry loops can dominate both capability and risk.
16. Where to check when new models are released
Use a layered monitoring strategy. Provider documentation establishes what was released; independent evaluations show how it compares; reproducible frameworks help verify claims; and model repositories expose artifacts for inspection.
Primary provider sources
- Anthropic: model overview, news, and system cards
- OpenAI: model documentation, API changelog, and release posts
- Google: Gemini model catalogue and Google DeepMind news
- xAI: model documentation and release news
- DeepSeek: transparency centre and API change log
- Meta Llama: official site, Meta AI blog, and model repositories
- Qwen: project blog and model repositories
- Mistral: model overview, news, and model repositories
- Ai2 OLMo: project page and source repository
Independent and reproducible comparison sources
| Source | Best use | Interpretation note |
|---|---|---|
| Arena | Human preference across text, code, vision, and other arenas | Useful for perceived response quality; not a substitute for factuality or domain testing |
| Artificial Analysis | Independent comparisons of quality, price, output speed, latency, and context | Review the methodology and individual benchmark components, not only the composite index |
| Stanford HELM | Transparent, scenario-based model evaluation | Strong for reproducibility and multidimensional analysis |
| Hugging Face Open LLM Leaderboard resources | Open-model results and reproducible artifacts | Check whether a leaderboard is active, archived, or tied to a specific benchmark generation |
| Epoch AI model database | Model chronology, compute, scale, and accessibility data | Useful for historical and structural comparison rather than product selection alone |
| MLCommons | Hardware and inference-system performance | Use for systems procurement and deployment analysis |
| Foundation Model Transparency Index | Comparing provider transparency practices | Transparency is not the same as capability, but it materially affects governance and trust |
| Stanford AI Index | Annual synthesis of technical, economic, policy, and societal trends | Best for broad context rather than day-to-day release tracking |
17. Final selection checklist
- The exact model version or checkpoint revision is recorded.
- The tested object—raw model, API, chat product, or complete application—is clearly identified.
- The release type is described accurately as closed, open-weight, partially open, or fully open.
- The licence and commercial-use restrictions have been reviewed.
- Parameter count, active parameters for MoE models, precision, and quantization are recorded.
- Weight memory, KV-cache growth, concurrency, and hardware headroom have been estimated.
- Training data, token count, compute, and post-training disclosure are recorded as published or not disclosed.
- Representative private tasks are the highest-weight part of the evaluation.
- Public benchmarks are selected by capability and their versions and harnesses are recorded.
- Reasoning effort, tools, search, retries, and token budgets are aligned across candidates.
- TTFT, TPOT or ITL, end-to-end latency, throughput, tail latency, and errors are tested under realistic load.
- Economics are calculated per successful task, including retries, tools, hosting, and human review.
- Groundedness, citation quality, calibration, safety, security, privacy, and prompt injection are tested.
- The selected model passes a pilot or shadow-traffic stage before receiving consequential permissions.
- Regression tests and a re-evaluation trigger are defined for model updates, alias changes, and retirements.
Further reading and live resources
Foundation models and transparency
- Stanford CRFM — On the Opportunities and Risks of Foundation Models
- Open Source Initiative — Open Source AI Definition
- Open Source Initiative — Open Weights versus Open Source AI
- Stanford Foundation Model Transparency Index
Model repositories and inspection
- Hugging Face — Model cards
- Hugging Face — Model repositories and files
- Hugging Face Hub — Downloading and pinning repository files
- Hugging Face Accelerate — Model memory estimator
- Hugging Face Transformers — Quantization overview